European Innovation Scoreboard 2026: a Nordic challenge
The Nordic countries are global leaders in innovation: Sweden, Denmark & Finland are amongst the top 5 in the European Union (EU) and the top 10 globally. In contrast, Norway & Iceland are innovation underperformers, relative to economic development: innovation outputs significantly lag innovation inputs.
Challenges: strong inputs, weak outputs
The European Innovation Scoreboard (EIS) compares research & innovation performance of EU countries and some non-EU countries. The 2026 EIS was published on 09 July 2026. The EIS generally reflects and further characterises the Global Innovation Index (GII) 2025, published on 16 September 2025.
Particularly, intellectual asset and trade impact outputs of Norwegian & Icelandic innovators continue to drag down on innovation inputs that otherwise approach or even exceed those of Swedish, Danish & Finnish innovators.
Trends: Sweden leads, Denmark & Finland follow closely, Norway & Iceland trail
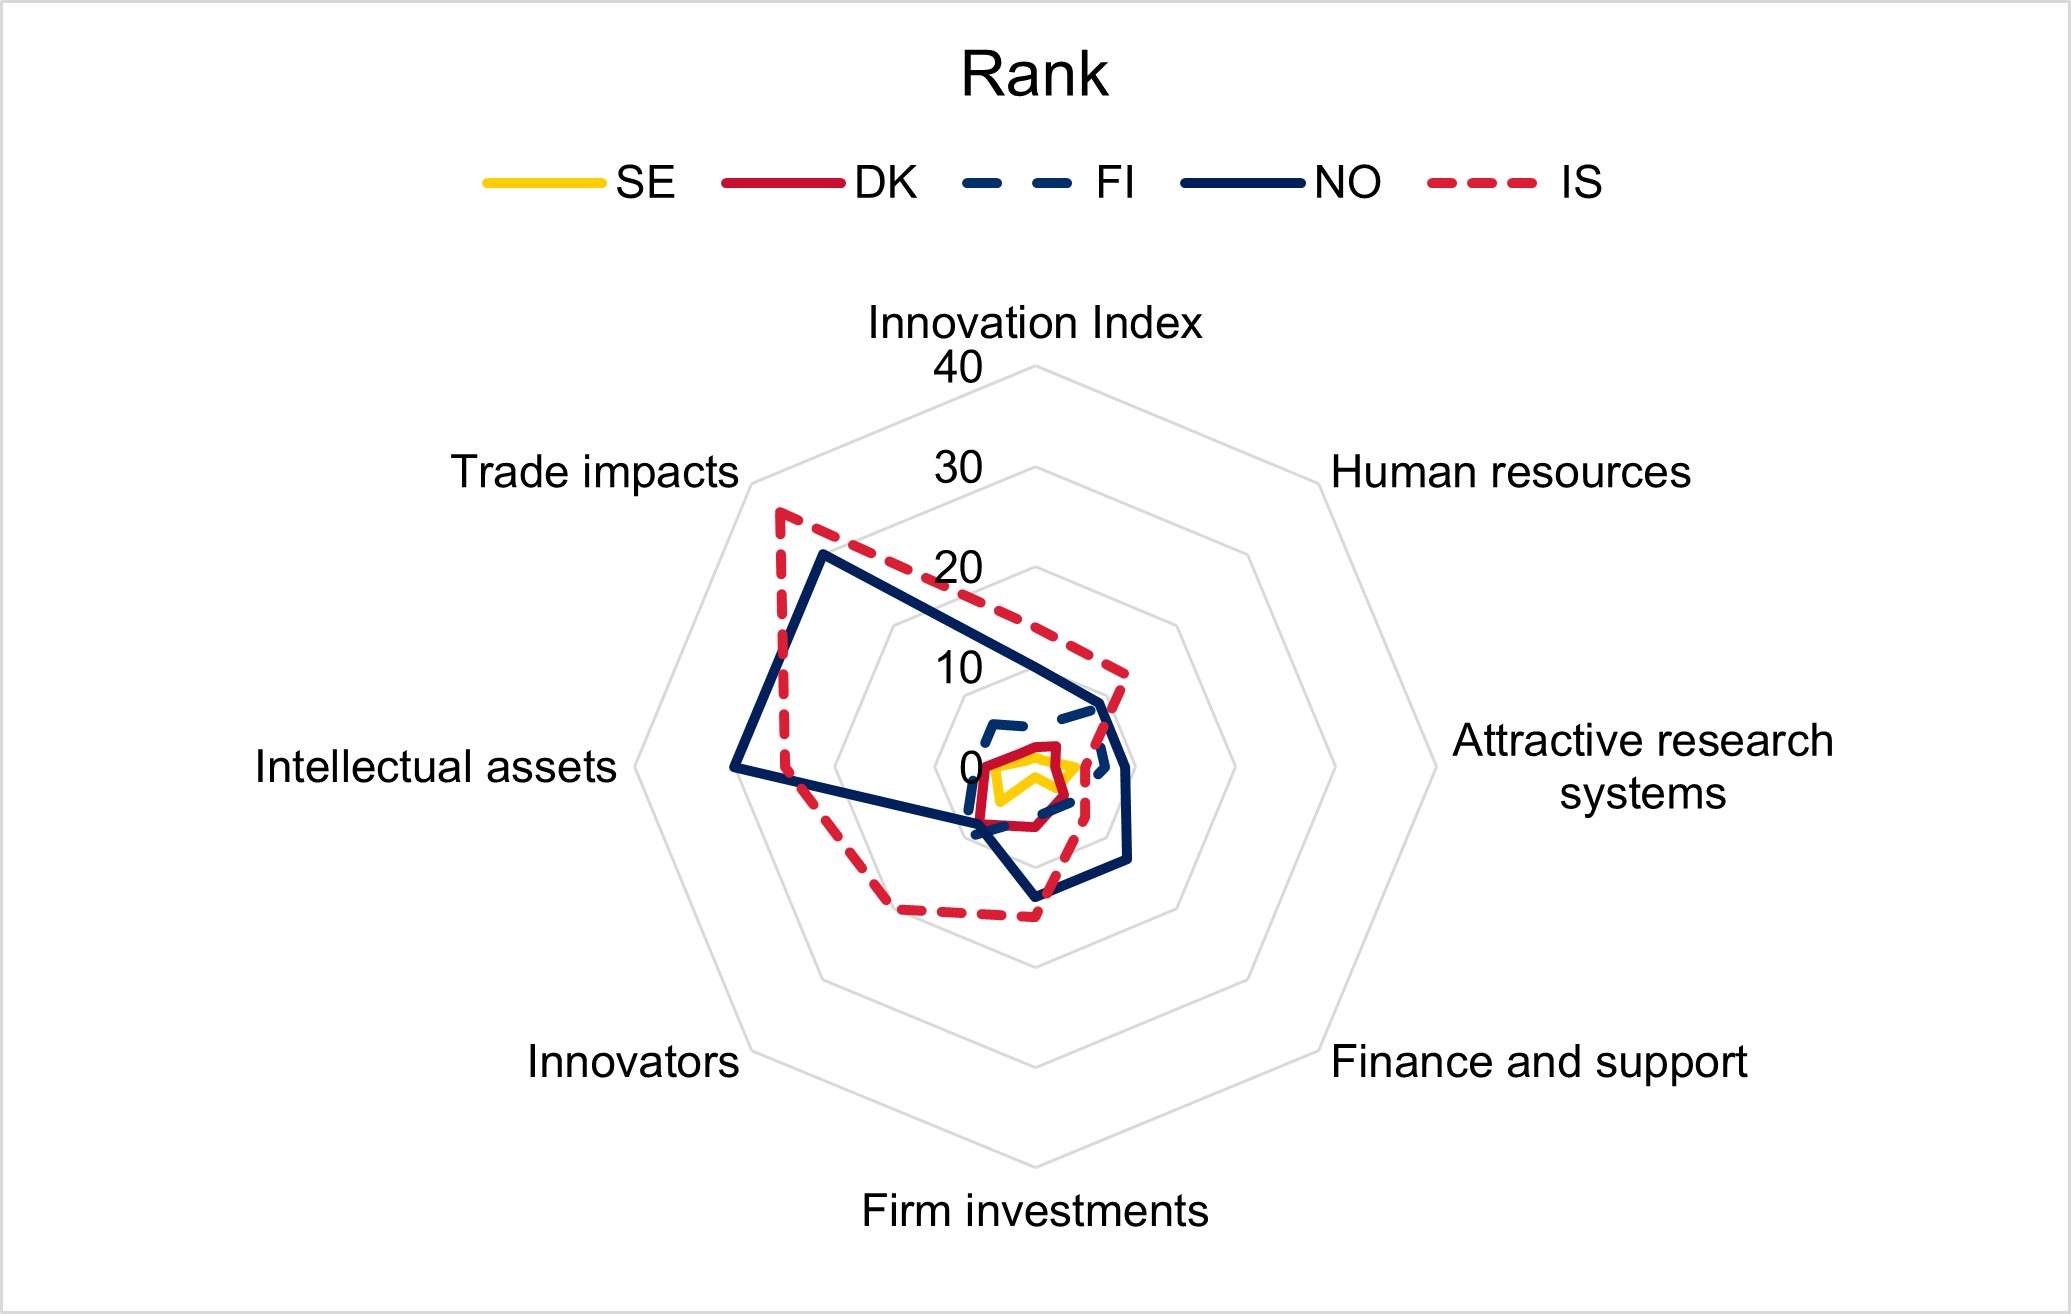
Figure 1: Rank among the EU and neighbouring countries. Lower values indicate higher rankings. Sweden (1st; 2nd) ranks 1st among EU Member States and 2nd among the EU and neighbouring countries and is indicated centrally. Rankings for the other Nordic countries are: Denmark (2nd; 3rd); Finland (4th; 6th); Norway (10th; 10th); and Iceland (14th; 14th). GII 2025 rankings: Sweden (2nd); Finland (7th); Denmark (9th); Norway (20th); and Iceland (24th). Despite relatively strong rankings in human resources, attractive research systems and innovators, Norway and Iceland are both significantly dragged by substantially below EU average rankings for intellectual assets and trade impacts while finance and support and firm investments are declining.
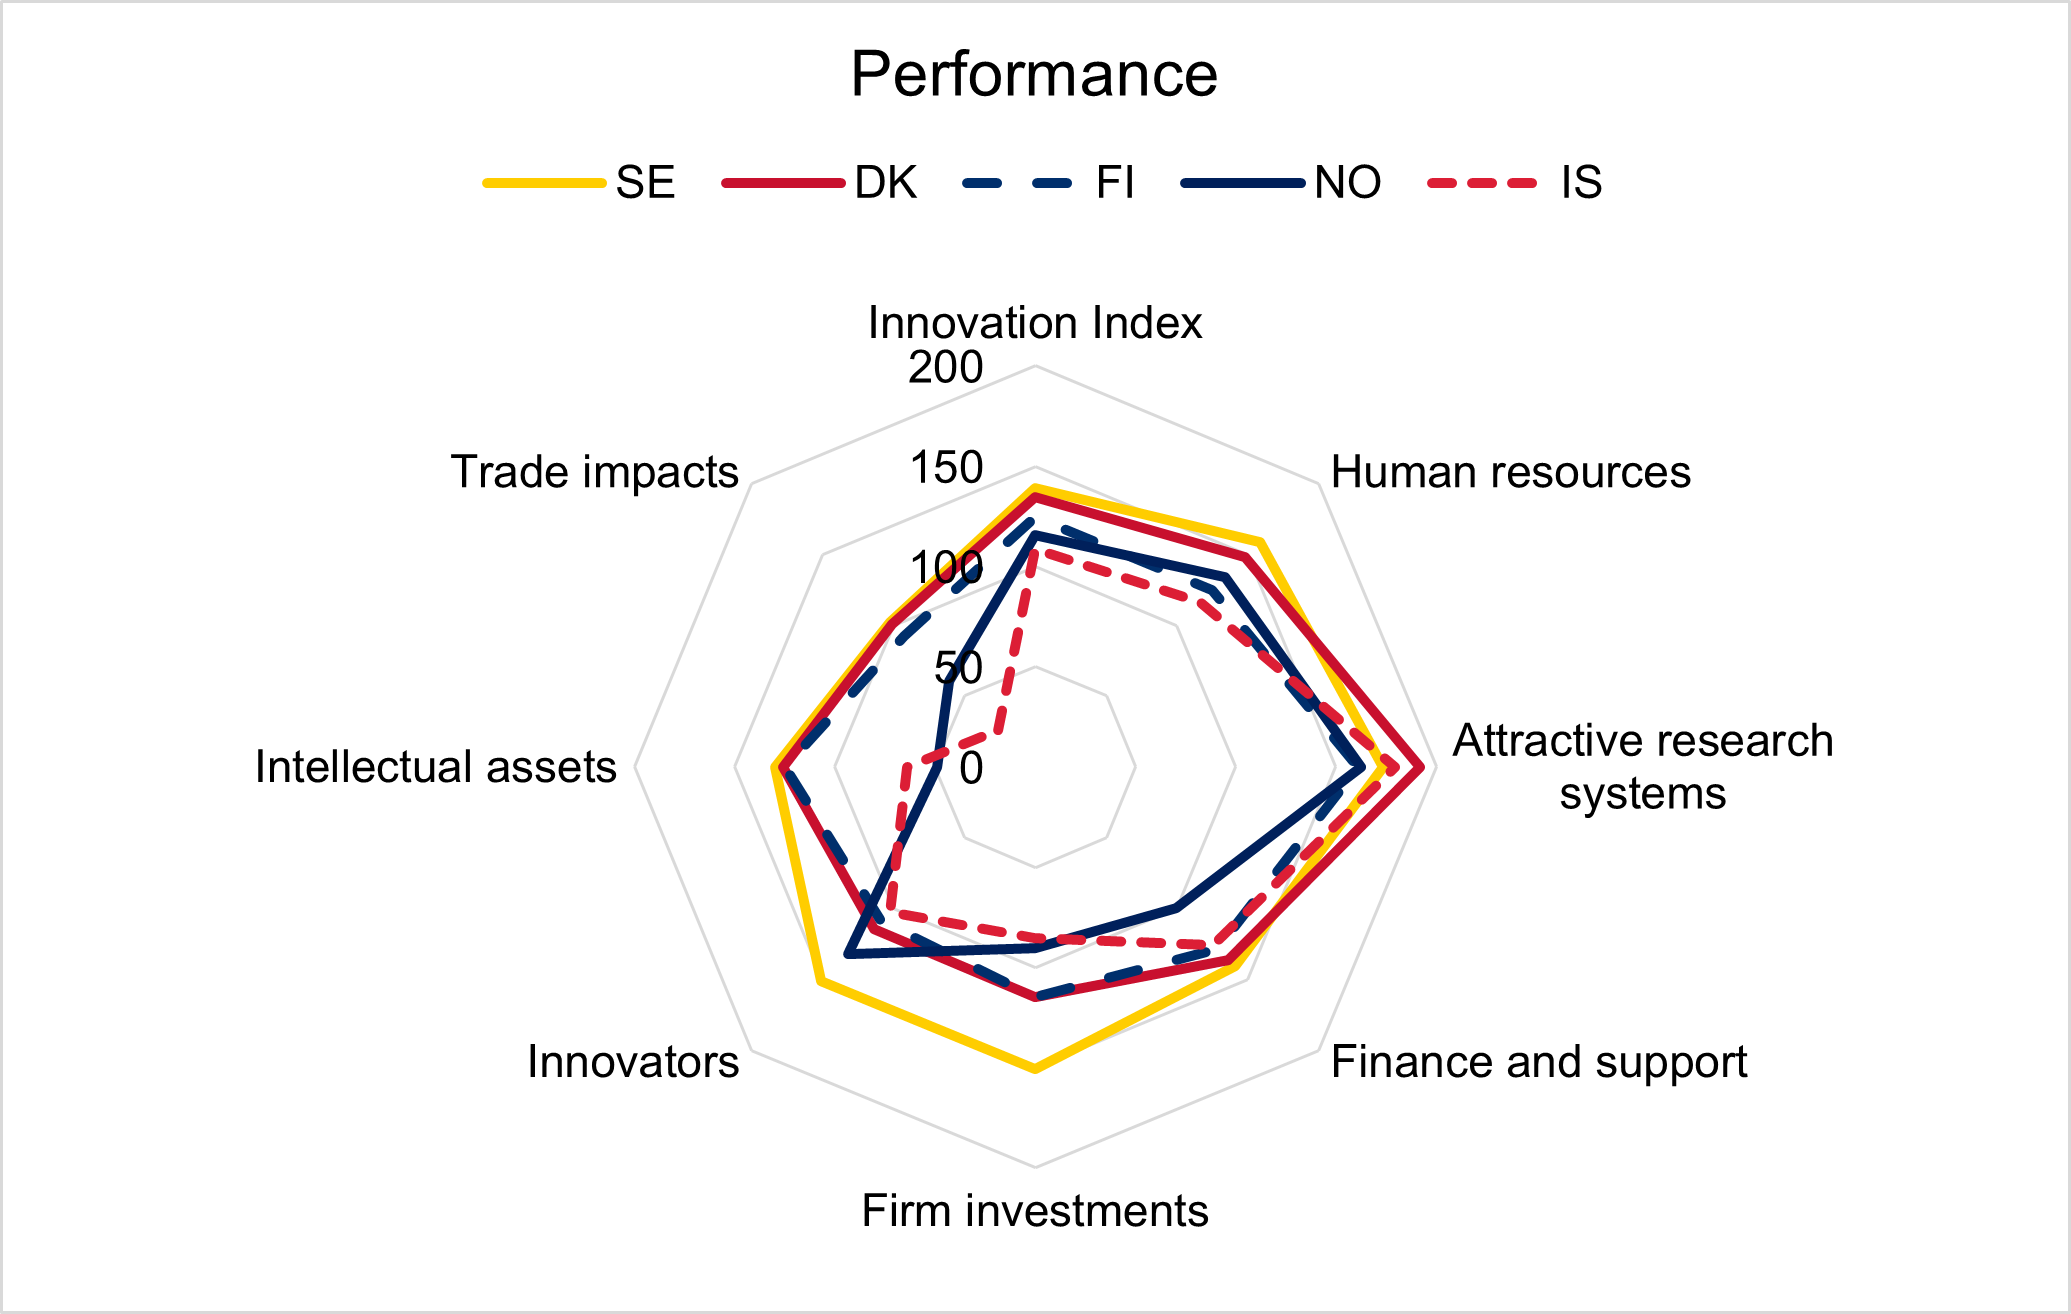
Figure 2: Performance indexed to the EU in 2026. Higher values indicate higher performance; EU average is 100%. Sweden (139.0%) is an Innovation Leader, performing with an Innovation Index of 139.0% of the EU average in 2026. Performances for the other Nordic countries are: Denmark (Innovation Leader; 134.7%), Finland (Strong Innovator; 124.4%), Norway (Strong Innovator; 115.7%) and Iceland (Strong Innovator; 108.9%). Norway and Iceland both have substantially below EU average performances for intellectual assets and trade impacts.
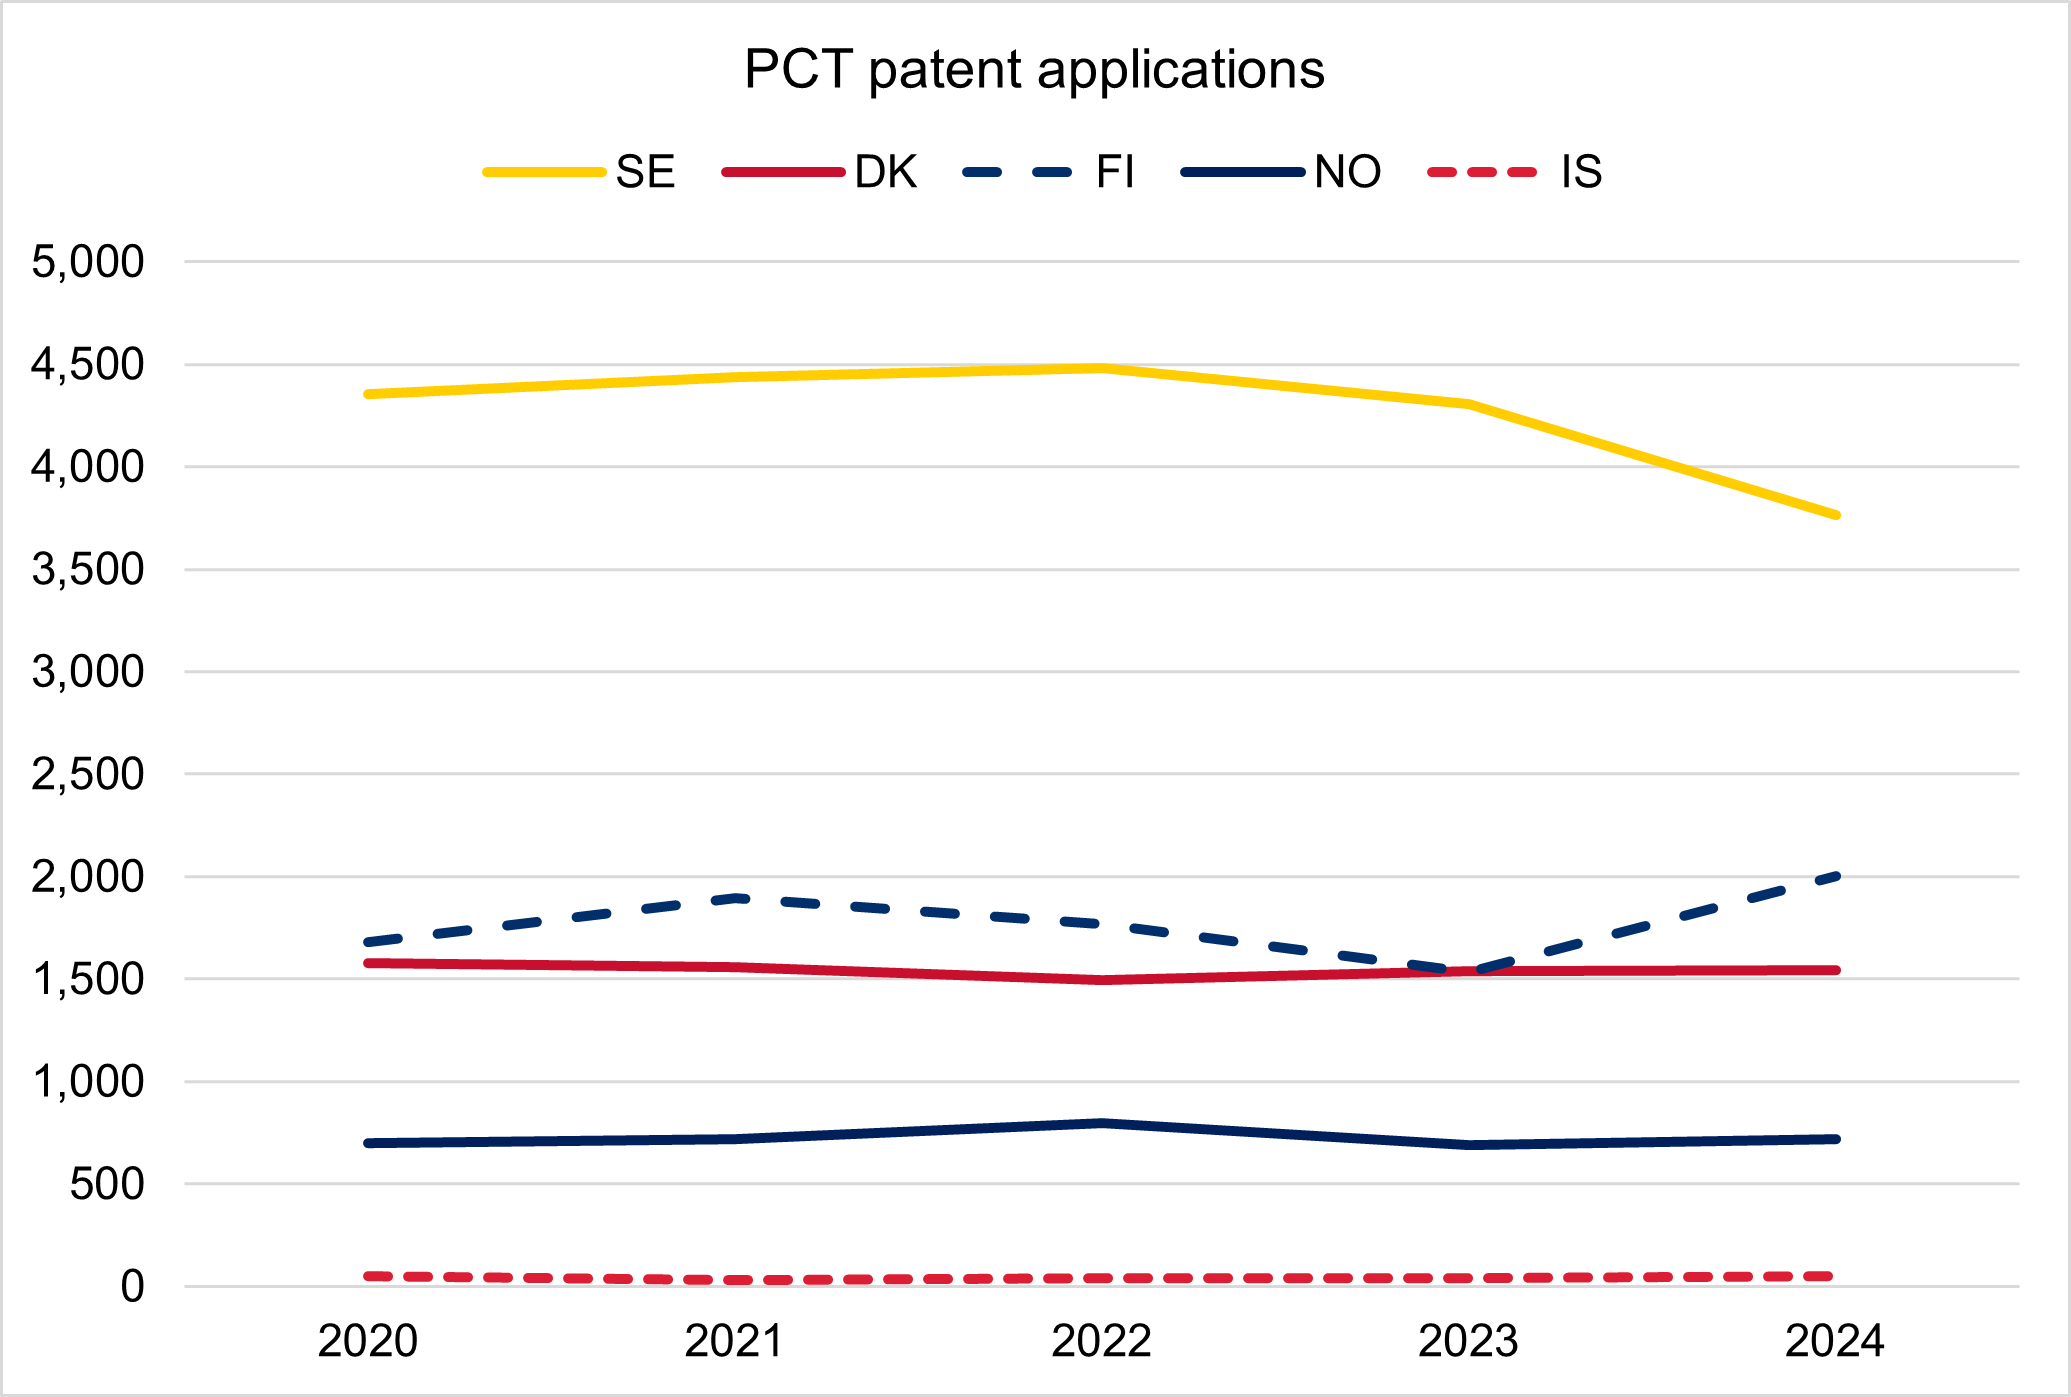
Figure 3: PCT patent applications filed annually by Nordic countries, 2020 to 2024. EIS intellectual assets performance is based on PCT patent applications, trade mark applications and design applications. Sweden (162.8%; 1st) & Finland (162.8%; 1st) are jointly ranked 1st for PCT patent applications while Denmark (151.2%; 3rd) is ranked 3rd. Norway (81%; 12th) and Iceland (93.2%; 11th) both file fewer PCT patent applications than EU average. Finland and Norway have similar populations but Finland files about three times as many PCT patent applications compared with Norway.
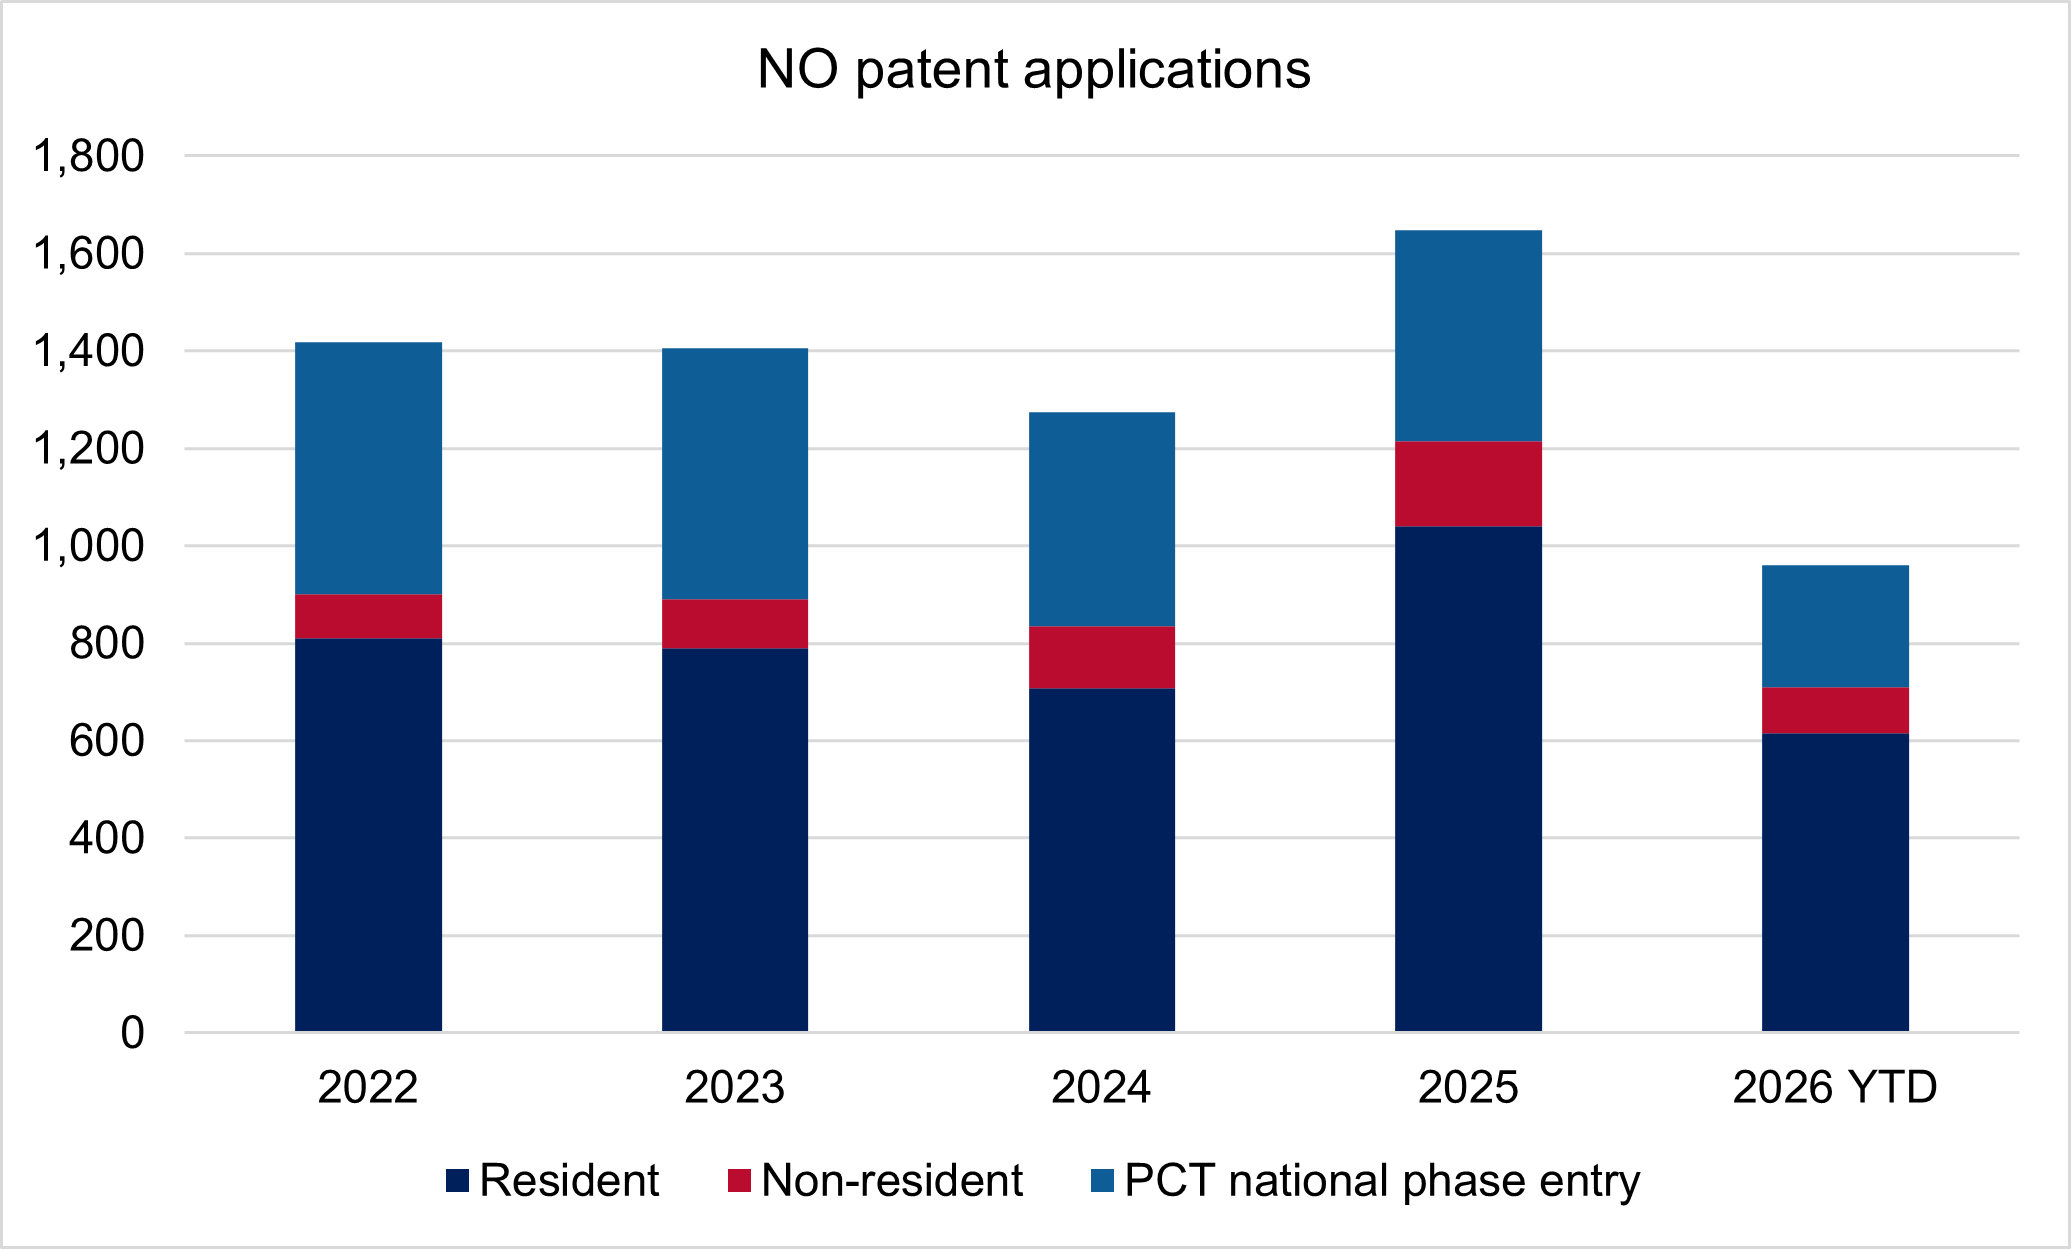
Figure 4: NO patent applications filed annually at Norwegian Industrial Property Office (NIPO), 2022 to 2026 YTD. Numbers are updated daily by the NIPO. PCT patent applications filed by Norwegian applicants typically claim priority from NO patent applications. Patent applications filed by Norwegian companies increased by about 30% in 2025 compared with 2024 while patent applications filed by natural persons (private applicants) increased about 100%. The trend of increased filing of patent applications in 2025 appears to continue in 2026 YTD.
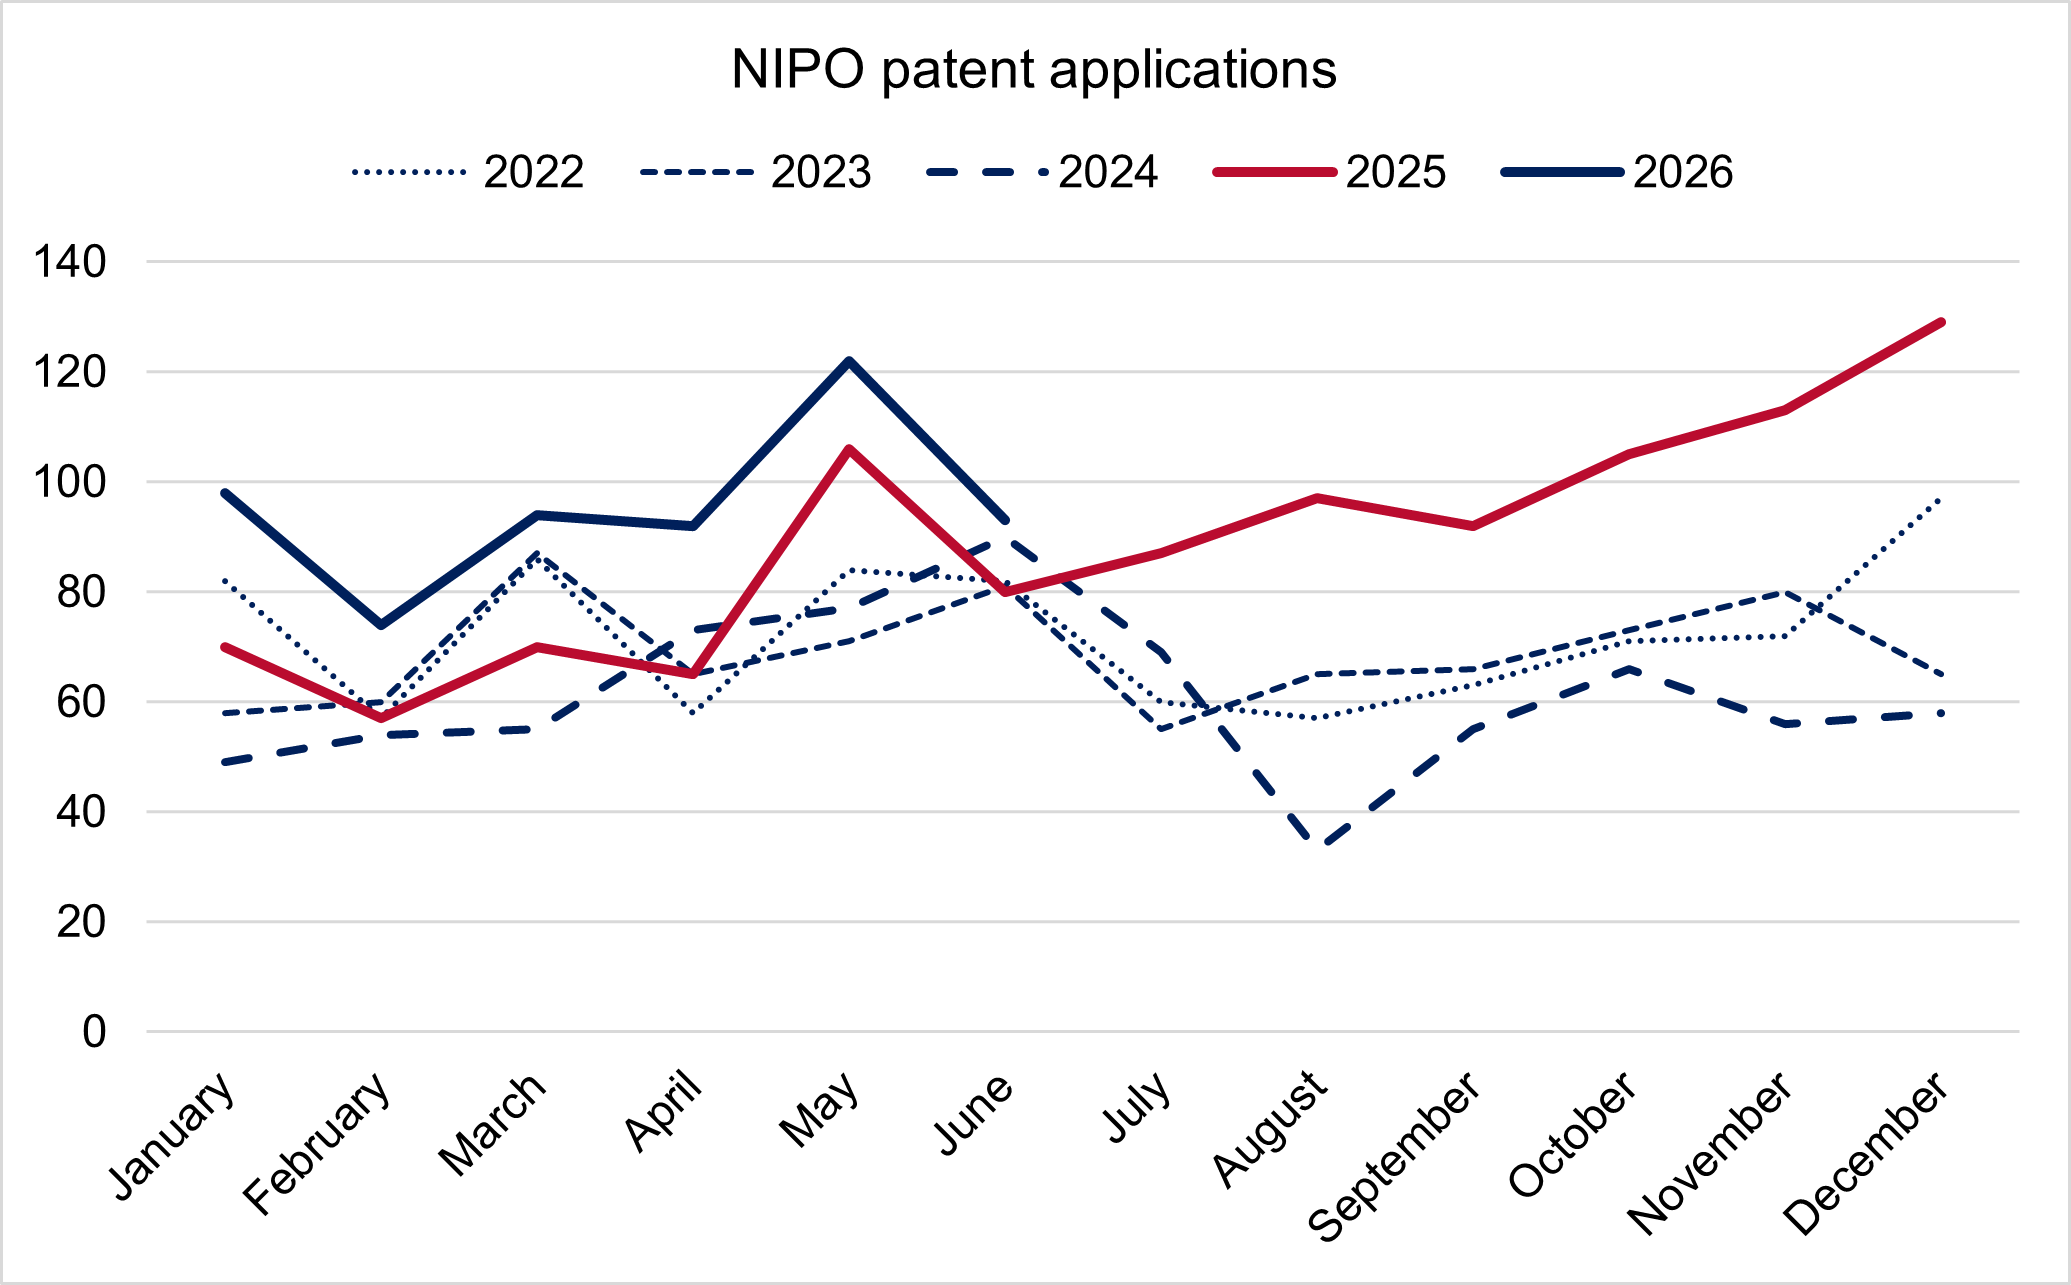
Figure 5: Patent applications (NO & PCT) filed monthly at NIPO, 2022 to 2026 YTD. The trend of increased filing of patent applications in 2025 first appears from July 2025 and continues in 2026. The NIPO has very recently suggested that private applicants are assisted by AI tools (Statistisk sentralbyrå): ‘KI-verktøy har vært tilgjengelige for rådgivningsfirmaer i flere år, men det nye er at mange privatsøkere bruker KI direkte i søknadsskrivingen. Foreløpige tall tyder på at vi ser samme utvikling i nabolandene våre.’ NO-EN: ‘AI tools have been available to consulting firms for several years, but what is new is that many private applicants are using AI directly in writing applications. Preliminary figures indicate that we are seeing the same development in our neighboring countries.’ It is not yet known if the trend of increased filing of patent applications from July 2025 will transform to increased filing of PCT patent applications.
Drivers & Solutions: priorities for Norway
Norway’s route to a higher ranking is not by further improving its already strong research systems and collaborations. Instead, Norway must improve conversion of knowledge from these research systems and collaborations into IP and high-tech exports, supported by increased R&D investment. Norway can achieve a top 5 ranking.
Increase R&D investment. Norway experienced one of the largest declines from 2025 to 2026 for finance and support (-15.6%) while Norway’s business R&D investment is only 64.8% of the EU average, far below Sweden (164.8%), Denmark (127.6%) and Finland (148.3%).
Norway’s economy remains particularly reliant on oil & gas and maritime, which are relatively less R&D-intensive than high-tech sectors including pharmaceuticals, computing and advanced manufacturing. Transitioning away from oil & gas to green energy, for example, will also cause improvement in performances and rankings for intellectual assets and trade impacts.
Convert collaboration into IP. Norwegian R&D collaborates extensively such that Norway ranks highly for international scientific co-publications (258.2%; 6th), public-private co-publications (464.6%; 5th) and innovative SMEs collaborating with others (228.3%; 3rd). However, Norway has an innovation-efficiency problem: the challenge is to generate IP outputs from these collaborations. Developing awareness of the value of IP (and the potential cost due to third-party IP) will enhance IP outputs. This will also improve returns on R&D investments and augment values of innovation-intensive exports.
Diversify to innovation-intensive exports. Norway performs poorly on trade impacts (60.6%; 30th) and particularly poorly on export of medium and high-tech products (2.6%; 38th) – the dependence on oil & gas exports. However, since Norway is already on track to meet a 2021 government target of increasing non-oil, non-gas exports by 50% by 2030 (Menon report), there is no incentive to further diversify to innovation-intensive exports. The target must be raised – and a plan implemented to achieve the raised target. This will also cause improvement in performances and rankings for R&D investment and trade impacts.
Winners, Losers & Disruptors: Norwegian purpose vs Swedish, Danish & Finnish intent
Norwegian innovators purposefully research, develop and deploy innovative products and services. However, patent protection is traditionally a secondary consideration for many Norwegian innovators – as evidenced by the performance and ranking for intellectual assets.
In contrast, Swedish, Danish and Finnish innovators research, develop and deploy innovative products and services with a more expansive intent. This results in leading performances and rankings for trade impacts for Sweden (102.3%; 1st), Denmark (100.8%; 2nd) and Finland (92.4%; 6th), supported by their respective intellectual assets for Sweden (130.0%; 4th), Denmark (125.8%; 5th) and Finland (124.7%; 6th).
While performances and rankings are headlines, the cost of failing to secure intellectual assets is tangible to Norwegian innovators: market exclusivity is lost and value is diminished.
Strategic Implications: innovators, investors, IP managers & leaders
Without adequate patent protection, Norwegian innovators are vulnerable to exploitation by competitors while third party patent protection will also limit their access to global markets. Market dominance in Norway will not translate to market opportunity abroad.
Norwegian innovators must prioritise transforming their purposeful R&D into patent-protected assets. Investors should assess the potential exclusivity in markets of interest – and which markets are closed. IP managers must be vigilant of competing or adjacent technologies and associated patent protection. And leaders must hold patent protection as a primary consideration in diversified technical fields.
What to watch next
Watch for: transformation of increased filing of NO patent applications to increased filing of PCT patent applications; conversion of collaboration into IP, assisted by AI tools; Norway accelerating towards a top 5 ranking by 2030.
What to do next
By understanding Norwegian R&D in a global context, Norwegian innovators can position themselves equally to their Swedish, Danish & Finnish peers – and ahead of global competitors. Get in touch.
References
- EU innovation scoreboard
- Global Innovation Index:
www.wipo.int/web-publications/global-innovation-index-2025/en/index.html
www.wipo.int/web-publications/global-innovation-index-2025/en/gii-2025-at-a-glance.html
www.wipo.int/web-publications/global-innovation-index-2025/en/cluster-ranking.html
- NIPO statistics
https://statistics.patentstyret.no/Patent/International
https://statistics.patentstyret.no/Patent/Norway
- Statistisk sentralbyrå
- EPO statistics
- WIPO statistics
https://www3.wipo.int/ipstats/key-search/indicator
https://www.wipo.int/edocs/statistics-country-profile/en/no.pdf